2003 World Climate Data
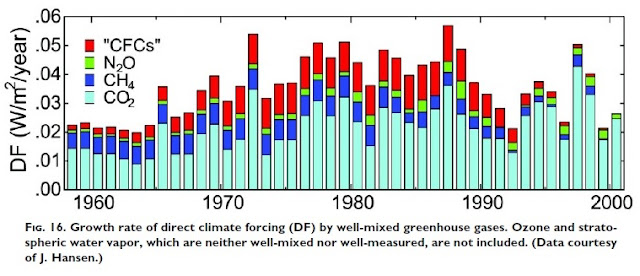
- Atmospheric CO2 concentration: 375.15ppm, +2.56 ppm from 2002
- Surface air temperature anomaly: +0.65°C/1.15°F, 12th all-time 1880-2021
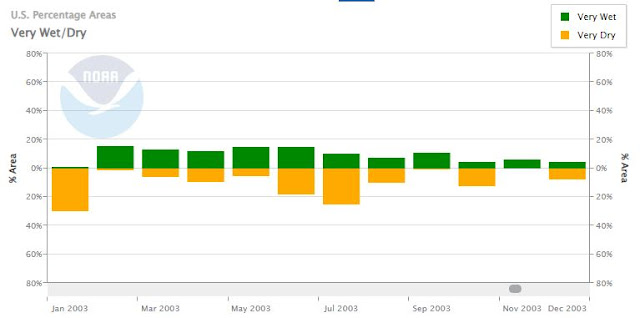
- Precipitation below 1961-1990 global average
- ENSO: Moderate El Niño till April; neutral for the rest of the year
Global Conditions
- Above-average temperatures: western Arctic Ocean basin; South America; southeastern China; Russia; Australia
- Below-average temperatures: European Russia
- Drought: northeastern South America; southeastern Africa; southeastern China; southeastern Australia; New Zealand; southern Asia
- Extreme rain: Argentina; northwestern South America; Algeria; Tunisia; the Sahel (central Africa south of the Sahara); Kenya; Yellow River basin; southwestern Asia (parts of Afghanistan and Pakistan, Iran)

2003 Significant Global Events Larger version
Though the El Niño event ended in April, its temperature effects
were felt through much of the year. To date, for global air temperature, 2003
was second only to 1998. While boreal spring (austral fall) rain patterns were
typical for an El Niño, the North Atlantic (boreal summer and fall) hurricane
season was extremely active. Southern and western Australia, recovering slowly
from 2002’s record drought, experienced a series of serious bush fires started
mostly by lightning.


Be brave, and be well.