
- Atmospheric CO2 conc.: 370.57 ppm, +1.61 ppm from 2000
- Surface (air & ocean) temp. anomaly: +0.51°C (0.92°F) over 1880-2000 ave
- Overland precipitation: -1.9% from 1961-1999 average
- ENSO: from La Niña to neutral
Departures (>10% difference) from 1961-1990 Average
- Warmth: southern Australia; New Zealand
- Cold: Siberia, eastern Russia, Mongolia—winter;
- Dryness: Brazil (austral summer); southern Africa; African horn; Cambodia; Vietnam; Iran; Pakistan; Afghanistan; Tajikistan; Uzbekistan; Turkmenistan; southern Australia; southwest Pacific
- Precipitation: South American Pampas (Uruguay, parts of Argentina and Brazil); northern
-
Australia

At the time, 2001 ranked second behind 1998 as the second-warmest for global surface air temperature (from 1880 forwards). Now it ranks 20th (1998 is tied for 17th). As a look forward—every year from the 1998-2013 period, falsely labeled a global warming “pause” by deniers–appears in the top 20 all-time. Warmer overland temperatures occurred largely in the tropics and northern hemisphere, where positive anomalies were greater than in the southern extratropics (>23.5° S).

World climate events, 2001. Larger version
Northern hemisphere snow cover was below average for the
fifth consecutive year, despite extreme cold in northern and eastern Asia and
extremely heavy snowfalls in Mongolia and northern China. Snow cover, like sea
ice, precipitation, drought and other climate indicators, is highly variable
from year to year, having many influencing factors. Snowmelt in areas such as
Alaska’s north slope (between the Brooks range and the Arctic Ocean) is
occurring earlier by the year.
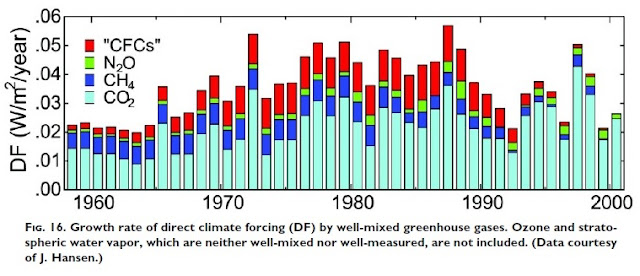
Radiative forcing—the heating contribution per year in watts per meter squared (W/m2/year) of each individual greenhouse gas, increased 0.026 W/m2 in 2001, almost entirely due to carbon dioxide. From the end of the last glaciation to the beginning of the industrial age (1750), radiative forcing has increased by roughly 2.8 W/m2, of which CO2 is responsible for about half. (2021’s CO2 concentration of 370.57 ppm is roughly one-third higher than the interglacial average.) Though the Antarctic ozone hole continues to exist and affect temperatures in the stratosphere, it is not growing at the rate that it did before. Both that and the decline of CFCs in the radiative forcing budget are the result of successful regulation.
Tomorrow: 2002 state of the climate, North America.
Be brave, and be well.
Columbia University Annual Temperature Anomaly Rankings
Columbia University Global Temperature Monitoring Page
American Meteorological Society (AMS) Climate Assessment Report page


No comments:
Post a Comment