Monday, February 28, 2022

365 Days of Climate Awareness 200: The Decline of the Great Barrier Reef: The Crown-of-Thorns Starfish


The crown-of-thorns starfish, Acanthaster planci, takes its name from the thick venomous spikes which grow on its aboral (back) side, facing outward and are typically 4-5 cm/1.5-2 in long. Adults range from 25-35 cm/10-14 in in diameter, very large for the Acanthaster genus. Its natural range is the warm waters of the Indian and Pacific oceans, and it feeds on hard coral polyps.


Do not touch.

In most respects these starfish behave like others of their genus, moving slowly via their flexible limbs across the reef or sea floor, and eat via a mouth located at the center of their body. A. planci, however, is one of the most efficient predators of hard coral polyps. A crown-of-thorns infestation can kill an entire reef colony. When this happens, the hard corals might be replaced by a number of different organisms, including filamentous algae, soft coral and sponges, in many cases preventing recovery by the hard coral.


Queensland government survey results for crown of thorns starfish on the Great Barrier Reef, 1985-2013. 

Crown-of-thorns outbreaks on the Great Barrier Reef can take a decade or more to happen, as successive waves of starfish spawn and spread. Since the 1960’s four major outbreaks have occurred, most recently in 2019. The frequency and severity of these outbreaks is killing reef colonies in areas, and lowering the density of corals enough in others to impact the other species. Pollution and overfishing have reduced the number of their predators, including pufferfish and triggerfish, and since the 70’s have helped create a long-term increase in the A. planci population.

Tomorrow: overfishing.

Be brave, and be well.

Sunday, February 27, 2022

365 Days of Climate Awareness 199 – Decline of the Great Barrier Reef: Pollution


The area of the Great Barrier Reef receives river runoff from nearly 23% of Queensland, much of which is via larger rivers from inland, which contain fertilizers and other organic runoff which leads to algal blooms in the ocean. Sewage has a similar effect. Toxic pollutants are also carried out, and can be taken up by organisms or be absorbed into the sediment. The toxins degrade the overall environment and repeated algal blooms can lower oxygen levels and have large impacts on the ecosystem, particularly by inhibiting the growth of new coral polyps.


Coastal regions showing effects of eutrophication and hypoxia.

Queensland features major sugarcane and cattle industries. Fertilizers from the sugarcane fields and organic wastes from the livestock contribute to the eutrophication of the coastal region, while pesticides poison most life. Aquaculture farms, increasingly important to the Australian economy, are another source of nutrients which upset the ecological balance. Farmed freshwater fish are an increasingly important industry in Queensland, and waste from those farms, livestock (cattle and swine) and sewage treatment plants.


Deforestation across several recent intervals (increasing redness = increasing deforestation). Note accelerated recent trend in the northeast (Queensland). Data from soe.environment.gov.au/…    

The increasing use of northeastern Australian coastal land has led to deforestation: 400,000 ha/988,000 acres,  roughly 2/3 the rate of Amazon forest loss, in 2015-16. Land conversion like this, in addition to removing the carbon sequestering abilities of the trees, frees soil to erode into the rivers and ocean, bringing more organics and a fresh blanket of sediment which further disrupts the local ecology. Studies have shown that sediment loads in Queensland rivers have increased by 5-9 times in the last 200 years.

Solid pollution such as plastics is another major threat to fish, turtles, dolphins and other larger species. Rivers are a consistent source of these solid wastes, but the effects are difficult to quantify, especially when they occur in combination with other influences.

Tomorrow: the crown of thorns starfish.

Be brave, and be well.

Saturday, February 26, 2022

365 Days of Global Warming 198 – Decline of the Great Barrier Reef: Ocean Warming and Acidification


Higher ocean temperatures put stress on coral polyps. In 2014, models predicted that with 1°C/1.8°F increase in water temperature, 82% of the Great Barrier Reef will bleach. 2°C/3.6°F of increase will lead to 97% of the reef bleaching, and 3°C/5.4°F of temperature rise will lead to widespread coral death. In addition, when the ocean absorbs carbon dioxide, the CO2 combines into weak carbonic acid: H2O + CO2 ↔ H2CO3 ↔ H+ + HCO3-


Impacts of ocean temperature increases on coral reefs.

The combined influence of hotter and more acidic water are a worldwide problem for coral reefs, and are part of what is damaging the Great Barrier Reef system. Though the trend is noisy—with large year-to-year variations—ocean water around Australia is roughly 0.5°C/0.9°F warmer now than the 1960-1991 average.


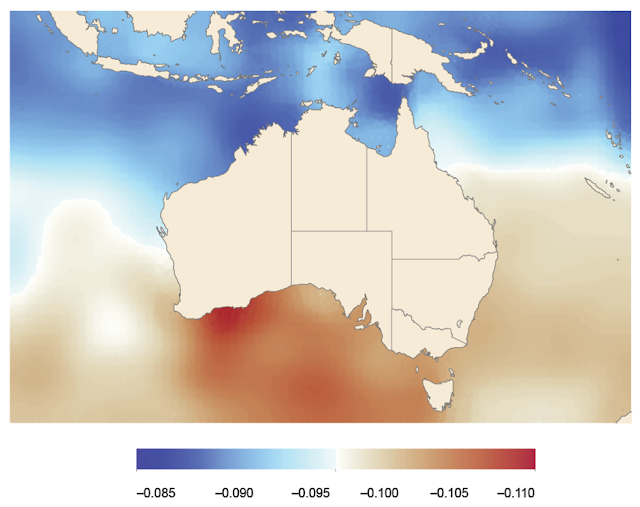
This temperature rise is not equally distributed, however, with warmer spots to northwest and southeast, while the northeast area of the Great Barrier Reef has warmed less, only 0.05-0.1°C/0.09-0.18°F.


Meanwhile the entire ocean around Australia has acidifed, though more in the south than the north. The trend between decadal averages, comparing 1880-89 to 2000-09 shows the northeast sector to have dropped in pH roughly 0.1 over that span.


pH trends, decade of 2000-09 compared to 1880-89.

Tomorrow: pollution.

Be brave, and be well.

Friday, February 25, 2022

365 Days of Climate Awareness 197: Decline of the Great Barrier Reef: Main Threats


The largest dangers to the Great Barrier Reef are the same as faced by coral reefs worldwide:

  • Warming water
  • Increasing acidity (dropping pH)
  • Increasing storm activity
  • Pollution
  • Overfishing
  • Predatory outbreaks (esp. crown-of-thorns)
  • Shipping

A number of monitoring and protection regimes have been enacted to protect parts or all of the reef, notably 2015’s “Reef 2050 Plan” between both the Australian national and Queensland governments.


When coral polyps are under stress, especially from heat, they expel the algae--zooxanthellae—from their tissues, a process known as “bleaching”. These algae help nourish the polyps and while the coral can survive while bleached, they are weaker and more susceptible to other threats. (Bleaching can also occur during anomalously cold water temperatures but this is much more rare.) 


As in many cases worldwide, it is not one threat but a combination which proves deadly. The process is reversible: when the source of stress--high water temperatures, usually--is removed, the corals will accept the zooxanthellae back into their bodies and resume normal living. Bleaching is a stress response but not a 100% predictor of coral death.


Thetford Reef (near Cairns) 2016, pre-bleaching.

A survey conducted in 2016 found that the Great Barrier Reef could be divided roughly into three zones based on extent of bleaching. The most widespread bleaching was in the north, in the tropical region. Moving southward the bleaching became progressively less severe, but still did occur.


Thetford Reef 2017, post-bleaching.

Tomorrow: warming waters in the Great Barrier Reef.

Be brave, and be well.

Thursday, February 24, 2022

365 Days of Climate Awareness 196 – Decline of the Great Barrier Reef, Introduction


The Great Barrier Reef is the world’s largest coral reef system, comprised of more than 2900 individual coral reefs and 900 islands off Australia’s northeastern coast. It stretches more than 2300 km/1400 mi, and is roughly 344,000 km2/133,000 mi2 in area, and is bordered to the northeast by the Coral Sea region of the South Pacific.


Australia and surrounding ocean, with the Great Barrier Reef. 

Coral reefs are the structures built from the exoskeletons of coral polyps, which over many successive generations create broad or wall-like mounds which become home to a huge range of marine life. In this way coral polyps, which feed off of photosynthesizing algae, are the physical (if not primary producing) foundation of massive marine ecosystems. The Great Barrier Reef is the largest of these.


Closer-up map of the reef extent.

Corals require warm water, between 23°C/73°F and 29°C/84°F, proximity to the sea surface for photosynthesis, and marine species which feed on other species of algae which would otherwise overrun the coral. With those basic elements present, many other species can find survival niches and so the community grows.


Closer view showing some of the reef segments, named individually.

Many thousands of species make their homes on and around the Great Barrier Reef, including more than 1620 species of fish, 300 species of mollusks and 500 species of algae (among many more). However, most of this region and the life on it is under increasing threat from many sources, including marine pollution, rising water temperatures and increasing ocean acidity.

Tomorrow: main threats.

Be brave, and be well.

Wednesday, February 23, 2022

365 Days of Climate Awareness 195 – Regional Profiles 5: New Zealand Glacial Melt


The Southern Alps stretch along the west coast of New Zealand’s South Island, the mountains built up by the collision of the Pacific and Australian tectonic plates. They are home to almost all of New Zealand’s glaciers, more than 3,000, due to the heavy snow and cold temperatures at elevation. The glaciers cover more than 1000 km2/385 mi2, but are rapidly shrinking.


Glaciers of New Zealand (red dots).

During the latter stage of the last glaciation, from 20,000-18,000 years ago, a large portion of the Southern Alps were fully glaciated. That large zone of ice has shrunk to the smaller, disconnected glaciers of today.


Ice coverage, last glacial maximum (20-18 KYA).

Investigators from the University of Leeds have recently mapped the extents of a number of glaciers throughout the Southern Alps of New Zealand. They have found that in the last 400 years (since the “Little Ice Age”), glacial melt rate has doubled over that time, and the glaciers have lost more than 77% of their mass. The glaciers of New Zealand appear headed for extinction.


From the early 1980’s to early 2000’s, a number of glaciers in the region regained mass, as colder temperatures prevailed. However, that increase has again reversed, and the index glaciers have resumed their rapid loss of mass.


Estimated mass loss, 50 index glaciers from the New Zealand Southern Alps, 1977-2009.

Tomorrow: overview of the Great Barrier Reef.

Be brave, and be well.

Tuesday, February 22, 2022

365 Days of Climate Awareness 194: Recent trends in New Zealand


 New Zealand’s greenhouse gas emissions have trended upward in recent years, like most countries’. Gross (versus net, which accounts for carbon dioxide removed by photosynthesis from forests and agriculture) emissions in 2016 were roughly 75 million tons CO2 equivalent (CO2e), as compared to Australia’s roughly 500 million tons CO2e for the same year. Agriculture accounted for about 40% of all emissions, with energy production next at about 20%.


Temperatures across both islands have been increasing, if not steadily each year, with a clear overall trend over the last century-plus: 1.09°C/1.96°F. Over the past two decades this trend appears to have accelerated. Per capita, New Zealand is one of the worse greenhouse gas emitters on the planet, ranking 21st worldwide in 2018, at 16.9 tons CO2e per person.

Measuring glacial ice loss by distance of the ice margin from an arbitrary point, six major experienced major melting through most of the 20th century, though some staged a bit of a recovery in the 1980’s.


Tomorrow: a closer look at New Zealand’s glaciers.

Be brave, and be well.

Monday, February 21, 2022

365 Days of Climate Awareness 193 – Temperature and Precipitation Trends, Australia


Australia as a whole has warmed 1.44°C ± 0.24°C (2.6°F ± 0.43°F) between 1910 and 2019, a bit higher than the global land average of 1.1°C/2.0°F. Temperature rise does not occur in isolation, of course. The surrounding ocean water  has warmed by roughly 1°C/1.8°F, and climate patterns have changed across the continent.


Australian land surface anomalies vs. 1961-1990 average.

Using a slightly different method, comparing the decade of 2010-2020 to the 1850-1900 average, national warming is shown to be uneven:

  • Australia: 1.6°C/2.9°F
  • New South Wales: 1.4°C/2.5°F
  • Northern Territory: 1.6°C/2.9°F
  • Queensland: 1.6°C/2.9°F
  • South Australia: 1.7°C/3.1°F
  • Tasmania: 1.1°C/2.0°F
  • Victoria: 1.2°C/2.2°F
  • Western Australia: 1.3°C/2.3°F

20th century warming has been over 1°C throughout the entire continent.


Monsoonal rain patterns have changed as well. The dry season of April to October (including austral winter) has become much drier in the southern half of the country, and mildly wetter in the north. Meanwhile, the wet season of October to April (which includes austral summer) has become significantly wetter across the western two-thirds of the continent, except for a narrow coastal zone in the southwest which, like the southeast, is drier. Like many (but not all) climatic trends associated with global warming, regional and seasonal variations throughout Australia have been exacerbated by increased heat in the ocean and atmosphere.


Dry season (April to October, including austral winter) precipitation trends in Australia, 2000-2020. 


Wet season (October to April, including austral summer) precipitation trends in Australia, 2000-2020. 

Australian greenhouse gas emissions had been steadily on the rise through the late 20th century, primarily due to increasing CO2, but the economic downturn of 2009-2011 reduced that sharply. Since then, carbon dioxide (through 2016) has remained fairly steady, never returning to early 2000’s levels, while methane (CH4) and nitrous oxide (NO2) levels have fallen.


Australian greenhouse gas emissions, 1990-2016.

Tomorrow: Temperature and precipitation trends, New Zealand

Be brave, and be well.

Sunday, February 20, 2022

365 Days of Climate Awareness 192 – Australia & New Zealand 2: Overview of New Zealand


New Zealand is a nation comprised of two main islands, separated by the dangerous Cook Strait, and located between the Pacific and Indian-Australian tectonic plates. It extends from 178° to 166°W longitude, and from 34° to 48°S latitude, and covers 268,021 km2 (103,500 mi2), about the same area as Colorado. New Zealand features an incredible range of habitats for such a small area, from glacial mountain valleys, to volcanoes, to plains, temperate rainforests and sunny (if not quite tropical) beaches. The islands are tectonically active, straddling a major fault. Most of the two islands fall under one Köppen classification: Cfb-temperate, no dry season, warm summer. The indigenous Maori, of Polynesian descent, arrived via canoe in the early to mid 1300’s CE.


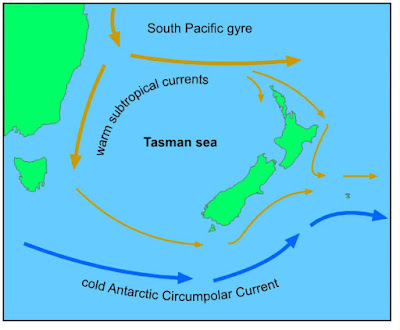
Equatorial waters which flow west through the Pacific, and then south along the east coast of Australia, create an anticyclonic (counterclockwise in the southern hemisphere) between that continent and New Zealand. The warm subtropical water also circulates eastward around the island’s southern tip, shielding it from the colder Antarctic Circumpolar current farther south.


Australia itself is bordered to east and west by warm southwardly-flowing currents, the Leeuwin on the west and the East Australian on the east. Flow on the tropical northern coast is complicated by nearby Papua New Guinea and the Indonesian Islands to its west, but the general pattern is westward and is called the Indonesian Throughflow.

Ocean currents around New Zealand.


Ocean currents around Australia.

Tomorrow: recent Australian temperature and precipitation trends.

Be brave, and be well.

Saturday, February 19, 2022

365 Days of Global Warming Awareness 191 – Regional Profiles. Australia & New Zealand 1: Overview


We’ll now be entering a different phase of the Awareness series. Having looked mostly at global patterns, I think it will be useful to examine and learn about the different regions of the planet.  Not only is it interesting to learn (and I speak for myself too here!) about an unfamiliar part of the world (or, if I chance to have any international readers, closer to home!). But it’s also good to further our understanding about how global warming is specifically impacting those other parts of the world, to give more breadth, detail and urgency to each of our own thinking (also the better to combat misinformation).


There will be several posts—not a rigorously uniform number, more a function of the available information—about areas all over the world, whether a single country or group of them, or more widespread areas such as Oceania or the western Indian Ocean. My bias as an American has been clear throughout this whole series and it’s time to rectify that somewhat with a lengthy perusal of the effects of global warming, not just globally, but on specific areas worldwide.


Today’s introductory post will focus on Australia, and tomorrow’s on New Zealand. Australia is a continent, including Tasmania and surrounding islands (not New Zealand, which is 1500 miles east and on a separate continental plate). It extends from roughly 153° to 112°W longitude, and from 44° to 11°S latitude, and covers 7,617,930 km2/2,941,300 mi2 (roughly the size of the continental US). A significant portion of the country is tropical, and its furthest southern extremity is classified as “cool temperate”.  


The southeastern coast features mountains, including the areas of Brisbane, Sydney and Melbourne. The city of Adelaide sits on the south coast, and Perth on the southwest. The city of Darwin, which is small in terms of population, but huge in importance for extraction industries like uranium, sits in the middle of the northern coast, and has its own time zone offset by 30 minutes from its neighbors. The interior of Australia is mostly desert, particularly in the west, so settlements are sparse. The entire country, including Tasmania and other islands, has been home to the Aborigines for over 50,000 years. Australia has two principal seasons: the wet season, from October to April, or austral summer, with monsoonal rains from the northwest; and the dry season, from April to October, or austral winter.

Tomorrow: introduction to New Zealand.

Be brave, and be well.

Friday, February 18, 2022

365 Days of Climate Awareness 190 – Space Weather and Climate Change


Space weather refers to the effects of the Sun on Earth. These effects range from changes in radiation strength—insolation—which changes how much light and heat arrive at the earth’s surface. They also include particle surges from solar events like flares and sunspots, which arrive at the earth’s magnetosphere—the outer edge of the planet’s magnetic field—and can disrupt radio transmissions and electronics across the planet.


While solar flares can (and do) emit massive bursts of charged particles which interfere with power grids and communications, they are of little or no importance concerning climate change. Particle storms do not affect the heat budget of the planet.


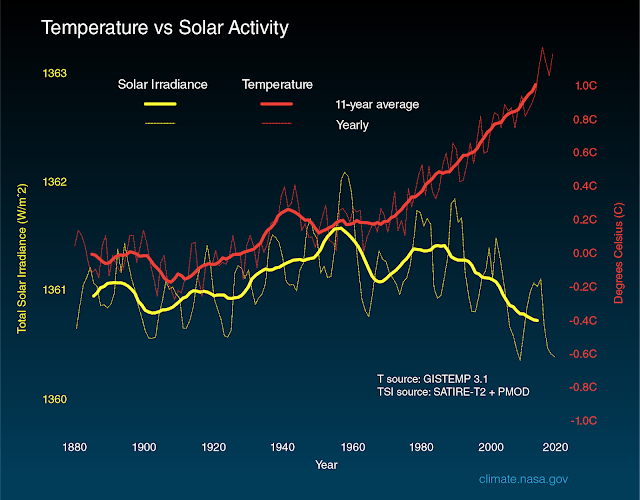
Variations in the Sun’s output do, however. As shown in the illustration, the Sun has a roughly 11-year cycle of sunspot activity. Sunspots are patches, sometimes roughly the same diameter as Earth, of lower surface temperatures on the Sun (3480°C/6300°F) than the surrounding areas (5540°C/10,000°F). Increased sunspot activity means lower surface temperature, and lowered output. This means lower insolation on Earth, and less heat input to the climate system. The 11-year cycle is a regular feature of solar activity and is not a driver of climate change.


There have been historical changes in solar irradiance, identified by proxy data. Astrophysical models state that roughly 4 billion years ago the Sun was only 70% as luminescent as now, and it will continue to burn more brightly with time as it continues to consume its fuel, helium (He) and hydrogen (H). The time scale of this change is too great to impact current climate change, however.


Tomorrow: regional profiles 1: Australia.

Be brave, and be well.

Not-Quite-Daily Climate Awareness The Inflation Reduction Act of 2022

(It might take me a while to find a workable new title. Bear with me.) Now that US President Joe Biden has signed the Inflation Reduction Ac...