Tuesday, November 30, 2021

365 Days of Climate Awareness 112 – The North Atlantic Oscillation


(Another shorty! A relief after yesterday...)

The North Atlantic Oscillation (NAO) is a surface atmospheric pressure variation between the Icelandic Low and the Azores High, and controls large-scale weather patterns such as westerly winds and storm tracks across the Atlantic basin. It is closely correlated with the Arctic Oscillation (AO), which measures surface air pressure differences between the Arctic and midlatitudes. The AO, however, includes both the Atlantic and Pacific.

General location of the Icelandic High and Azores Low.

The calculation for the index is very complex. A positive NAO index (NAOI) indicates both the Icelandic Low and Azores High are strong, with a large pressure difference between them. A large positive value (>1) predicts warm weather in the eastern United States and northern Europe, and cold weather in southern Europe. It also indicates higher sea level in the northern Atlantic Ocean, due to the lowered air pressure (which allows the seawater to expand). This is important in interpreting paleo-sea level records for the Atlantic basin.


A negative NAOI indicates the high and low features are weak, with a smaller pressure differential between them. A large negative value (<-1) indicates cold temperatures in the eastern United States and northern Europe, and warmer conditions in southern Europe.


Tomorrow: the North Pacific Oscillation.

Be brave, and be well.

Monday, November 29, 2021

365 Days of Climate Awareness 111 – Rossby Waves


I’ve mentioned Rossby (planetary) waves in a number of posts. With each passing mention the realization grew in me that I need to explain—or attempt an explanation—of this very important global phenomenon. Every time you look at a weather map and see the jet stream snaking across Canada and the northern United States, you’re looking at Rossby waves rhythmically perturbing the air flow. They’re a complicated topic but I’ll give it a shot! (This will be another longer-than-usual post. But that’s okay because yesterday’s was really short. :P ).

Rossby waves, also known as planetary waves, are large-scale north-south fluctuations in the atmosphere and ocean. Their amplitude can be hundreds of miles, and one wavelength can be over a thousand. Waves are disturbances in a continuum—sound waves in the air, wind-driven waves on the ocean surface—where a restoring force acts to correct the disturbance. But the restoring force overcorrects, and pushes the medium in the opposite direction, creating the back-and-forth fluctuation. In sound waves, the restoring force is pressure—whether of air, water, or a solid (solids transmit sounds!). In wind-driven ocean waves, the restoring force is gravity. In Rossby waves, the restoring force  is (effectively) the Coriolis effect.

Schematic of a northern-hemisphere Rossby wave.

The Coriolis effect is a function of the vorticity within a fluid. Vorticity is, simply put, a measure of the angular momentum—the spin—at a given point in a fluid. Earth being a rotating sphere, vorticity varies from zero at the equator to its maximum value at the poles. Let’s assume some ocean water at a given latitude—50°N, for example—happened to be pushed to the north. The water moving to the north has negative vorticity—that is, less angular momentum—less spin--than the water around it. This negative vorticity manifests as the water from farther south being diverted to the right, in a clockwise motion.  This continual diversion to the right results in the water moving back to the south.

Likewise, if water from 50°N were pushed to the south, it would have greater vorticity (spin) than the more southerly water, resulting in its being diverted to the left, counterclockwise. The result is a wavelike motion, where water carried to the north or south, usually due to a pressure imbalance, begins to move in a curved path back toward its original latitude. Momentum then carries the parcel of water past its original latitude—into overshoot--and so the north-to-south wave motion is created.

Jet stream Rossby wave fluctuations.

This process is not limited to ocean water in the northern hemisphere. The same thing happens in the southern hemisphere: water moving south is diverted counterclockwise to the left, and water moving to the north is diverted clockwise to the right, again setting up the north-to-south Rossby wave motion. These waves occur in the atmosphere as well—in fact they’re named after the Swedish meteorologist, Carl-Gustaf Rossby, who discovered them.

The group velocity—how quickly the peaks and crests move—of a Rossby wave is slow. Atmospheric Rossby waves might take several weeks to travel across North America, while oceanic Rossby waves take months to cross a basin. Faster planetary waves have a westward group velocity, where the peaks and crests move to the west; slower wave crests travel to the east.

Meteorology, oceanography and even astrophysics share fluid dynamics. The same equations, with different numbers for variables like mass, velocity, and viscosity, are used to describe liquids, gases, and plasma. The rotational dynamics of the surface of the Sun and the outer layer of Jupiter are modeled in exactly the same way we do our own atmosphere.

As an aside: Carl’s son Tom was one of my grad school advisors. You’re not likely to find a gentler, kinder man. His Christmas glög parties were legendary, but he stopped throwing them because they lasted till dawn and he got too tired. Tom categorically refused to use the term “Rossby wave”—he insisted on the term planetary. He was modest enough to tell the story of how he flunked his first oral doctorate exam, but also loved tossing in a question on every final that had nothing whatsoever to do with his lectures—just to “see how we’d handle it.” He happens to be one of the most celebrated ocean researchers of the 20th century and is responsible for a good deal of our understanding of mid-ocean-depth dynamics.

Tomorrow: the North Atlantic Oscillation.

Be brave, and be well.

Sunday, November 28, 2021

365 Days of Climate Awareness 110 – The Madden-Julian Oscillation


The Madden-Julian Oscillation (MJO) is a fluctuation in tropical weather, from the upper atmosphere down to surface ocean currents, on the scale of weeks to months which moves east through the Indian and Pacific Oceans. It was discovered in 1971 by meterologists Roland Madden and Paul Julian, and consists of eastward-moving convection cells of alternating rain and dry weather.

The weather cells move eastward across the basin at between 4 and 8 m/s. Because of the length of time it takes for one phase (stormy or dry) to pass by, the MJO is also known as the 30-60 day wave (oscillation). The upper-atmosphere fluctuations continue around the globe, but the surface weather patterns are confined largely to the Indian and Pacific.


MJO (30-60 day wave) schematic.

The oscillations can affect weather as far as 30° to north and south. The wind and storm activity associated with these oscillations drive surface currents to a depth of 100 m. In Northern Hemisphere summer and fall (Jun-Nov), the cells can at times stall, leading to persistent rainy weather on the western side of the Indian Ocean basin.


The eastward migration of the stormy and clear cells are consistent with a large-scale type of fluctuation known as a Rossby (planetary) wave, a north-to south wave which appears in wind patterns and ocean currents, and can travel either west or east. No obvious mechanism for these oscillations has been found.


MJO phases.

Tomorrow: Rossby waves.

Be brave, and be well.

Saturday, November 27, 2021

365 Days of Climate Awareness 109 – The Indian Ocean Dipole


The Indian Ocean Dipole (IOD) is also known as the Indian Niño, because it features the irregular variation of warm and cold sea surface temperatures on the eastern and western regions of the Indian Ocean basin. There is no obvious mechanism, as it is not, like El Niño, due to a failure of the westward trade winds allowing the eastward flow of warm water.

Indian Ocean Dipole index, 1896-1998.

The Dipole exists in three phases: positive, neutral and negative. In the positive phase, the western surface waters off the coast of East Africa, between the horn (coastal Somalia) and Madagascar are warm, and the eastern waters around Indonesia are cool. In the neutral phase, there is little temperature difference. In the negative phase, Indonesian waters are warm, while east African waters are cool.

IOD, positive phase: warmer, wetter west, and cooler, drier east.

The regional weather effects can be dramatic. Where the ocean surface water is warm, atmospheric updrafts form due to evaporating water, leading to increased rain. Where the surface water is cool, drier air descends to the sea surface, leading to clear, dry weather. A positive IOD phase leads not uncommonly to drought in Australia. For these reasons the IOD is considered to be a joint oceanic and atmospheric variation.

IOD neutral phase: weather patterns closer to average.

The IOD seems to be correlated to ENSO. A positive IOD phase is often accompanied by an El Niño event, the negative by La Niña, but the correlation is not extremely strong, and the mechanism is not yet understood.

IOD negative phase: warmer, wetter east, cooler, drier west.

Tomorrow: the Madden-Julian Oscillation (MJO).

Be brave, and be well.

Thursday, November 25, 2021

365 Days of Climate Awareness 108 – The Arctic Multidecadal Oscillation


The Arctic Multidecadal Oscillation (AMO), also known as the Arctic Multidecadal Variability (AMV), is a reasonably periodic variation in the sea surface temperature (SST) of the North Atlantic Ocean. Year-to-year variability is great, but a rolling average of SSTs shows a clear, if not smooth, pattern. The two names, ending in oscillation and variation, highlight the debate over its nature: is the change from cold to warm modes regular enough to be called an oscillation, or is it too erratic to merit comparison to a wave?

The AMO index is calculated from long-term surface temperature records, once any linear trend (overall ocean warming) has been removed. The goal is to identify shorter-term variation while minimizing long-term forcing. Temperature records from the last 150 years show a roughly 70-year period, but the historical record is too short to extrapolate far. Nor have any mechanisms been clearly identified.

The AMO appears to be correlated to air temperatures and weather patterns across the northern hemisphere. The severe droughts and Dust Bowl of the American midwest in the 1930's, and the droughts of the 1950's, occurred during one of the AMO's warm phases. The AMO also seems to contribute to the development of severe hurricanes from tropical cyclones. It is also correlated with increased rain in the Sahel (the arid land between the Sahara to the north and the Sudanese savanna to the south) and India. Even so, the link between the AMO and North Atlantic hurricane activity is disputed by some climate scientists. There is as yet no consensus.

North Atlantic cyclone activity, 1950-present.

A 2021 study of the last millennium by climate science magnate Michael Mann identifies volcanoes as the main driver of the AMO. In other words, the apparently regular variation over the last 150 years is in fact “red noise”, that is, mostly random noise which favors lower frequencies (such as red in the visible spectrum), as opposed to “white noise”, where frequencies are spread evenly across the full spectrum. But suffice it to say that the Atlantic Multidecadal Oscillation is an area of active research.

In that way, it's an excellent example of the scientific process. A scientist sees a record—perhaps by reinterpreting existing data—and finds a new pattern. She or he lights on a hypothesis, tests it, and publishes results and conclusions. Colleagues read the article, or listen to the talk. Some might agree. Others think, “No way, you're wrong, and I'll prove it,” and set out to test and destroy it. Though it lacks the obvious bravado of a football field or ice rink, scientific research can be a pretty vicious arena. (One reason why I'm in applied science!)

Tomorrow: the Indian Ocean Dipole (IOD).

Be brave, and be well.

365 Days of Climate Awareness 107 – The Arctic Oscillation (AO)


The Arctic Oscillation, or Northern Annular Mode, is analogous to the Antarctic Oscillation/Southern Annular Mode. It describes surface air pressure anomalies—differences from long-term average—near the north pole and farther south, and their effect on the jet stream. A pressure balance seesaws between more poleward (>60°N) and more southerly (~40°N) latitudes.


Changes in the pressure balance change large-scale wind patterns. The difference is that, with the AAO (SAM) in the Antarctic, the south pole is on a continent which is surrounded by ocean, where winds can blow with little interruption. In the AO/NAM in the Arctic, the north pole is within an ocean basin surrounded by land which can significantly disrupt the jet stream.


When the AO/NAM index is positive, cold arctic air is confined with the jet stream largely to the far north. Storms and cold winter weather are mostly north of 40°latitude. There is more precipitation in Alaska, Canada, Scotland and Scandinavia, while it is drier and warmer in the southern United States and Mediterranean. The trade winds are stronger in a positive AO phase.

20th century Arctic Oscillation indices.


When the AO is negative, the jet stream meanders significantly to north and south (in large-scale bends called Rossby waves), bringing pulses of warm weather to the north, and extremely cold weather to the southern United States and Europe. Storm activity also shifts southward,leading to colder, rainier weather in the Mediterranean and weaker trade winds. There does appear to be a correlation between the Arctic Oscillation and ENSO, but this is a current area of research: the mechanism is not yet well understood.

The rhythm (periodicity) of the Arctic Oscillation is irregular, but has been tending to the positive (more northerly) mode in recent decades (2010 was a major departure from that trend).

Tomorrow: the Arctic Multidecadal Oscillation (AMO).

Be brave, and be well.

365 Days of Climate Awareness 106 – The Antarctic Oscillation (AAO)


The Antarctic Oscillation, also known as the Southern Annular Mode, is the southern analog to the Arctic Oscillation (Northern Annular Mode). It features the alternation of strong westerly (i.e. from the west and toward the east) winds blowing farther south at roughly 65ºS latitude, and farther north, at about 40ºS latitude. It affects climate patterns in Australia and Antarctica.

Antarctica (note 40º and Antarctic Circle [63.5º] lines of latitude).


The variation is caused by air pressure seesawing between the higher(~65ºS) and lower (~40ºS) latitudes. The index formula, as for the Southern Oscillation Index and others, is complex, involving historical pressure anomalies(departures from average).


When the AAO (SAM) index is positive, the belt of strong westerly winds moves south toward Antarctica. Most of Australia's winter weather is affected, with rain in the southeast and dry conditions in the southwest. The more southern westerly winds intensify the Antarctic Circumpolar Current, and possibly cause coastal upwelling around the entire continent, increasing ice shelf melt.


Positive AAO events are weakly correlated with La Niña. In recent years the AAO index has shown an increasing tendency to be positive during the southern hemisphere summer and fall months (December to May). There is a theory, not yet well demonstrated enough to become consensus,that the growing positive tendency of the AAO is correlated with global warming.

A negative AAO index means the westerlies are closer to the equator,bringing dry weather to southeastern Australia and snowy winters to the southwest and south central regions. Negative AAO events are weakly correlated with El Niño. The oscillation's rhythm is irregular, ranging from weeks to months.

Tomorrow:the Arctic Oscillation (AO).

Be brave, and be well.

365 Days of Climate Awareness 105 – Ocean oscillations, and a review of El Niño (ENSO)


The planet is alive with pulses of matter and energy on a huge range of spatial and temporal scales.They range from the nearly instantaneous travel of radiation, to pressure waves which travel through rock, water and air at several hundred meters per second, and slower cycles such as tides on the scale of hours (and weeks, depending on the moon’s phase), and weather systems on days, to say nothing of volcanic and tectonic processes. But large oscillations of currents,air and water pressure occur in and above the ocean, on the scale of thousands of miles. Their periods range from months to decades, and they can have dramatic global effects.

Over the next several posts I'll briefly introduce them to you. They are:

  • Antarctic Oscillation (AAO)

  • Arctic Oscillation (AO)

  • Arctic Multidecadal Oscillation (AMO)

  • Indian Ocean Dipole (IOD)

  • Madden-Julian Oscillation (MJO)

  • North Atlantic Oscillation (NAO)

  • North Pacific Gyre Oscillation (NPGO)

  • North Pacific Oscillation (NPO)

  • Pacific Decadal Oscillation (PDO)

  • Pacific-North American Pattern (PNA)

Since ocean water has roughly 3,000 times the heat capacity of air, the ocean's dominant effect must be included in any analysis of global weather and climate patterns.


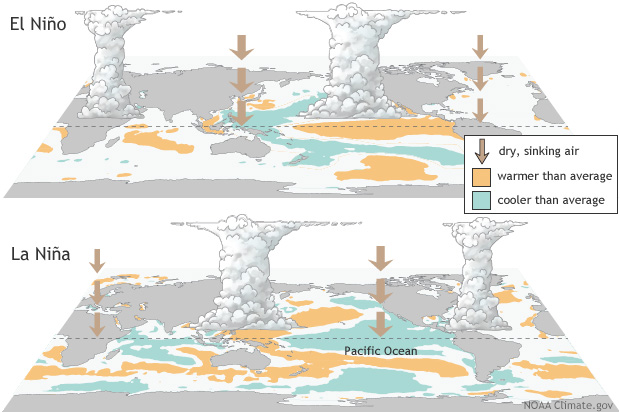
Schematic of El Niño and La Niña.

A quick review here of the best-known of all oceanic oscillations: the  El Niño-Southern Oscillation (ENSO). These are coupled oceanic and atmospheric variations. In an El Niño phase—named for its appearance around Christmastime—an equatorial current of warm water flows east from the western Pacific to the coast of South America. At the same time the Southern Oscillation Index (SOI) involves comparing air pressure measurements at Darwin, Australia (central Pacific) with Tahiti (western Pacific). A negative SOI is strongly correlated (though not 100%) with an El Niño event. La Niña usually occurs when the SOI is positive and involves cold water upwelling in the eastern equatorial Pacific and flowing west.

Global effects of El Niño.


The rise of warm air above the warm current in the eastern Pacific during El Niño leads to wet conditions along the equatorial Pacific, in the southern United States, and zones in Africa and eastern South America. La Niña produces warm rainy weather in the western Pacific and northern South America, and warm, dry weather across the southern United States.

Global effects of La Niña.

Tomorrow: The Antarctic oscillation (AAO).

Be brave, and be well.

365 Days of Climate Awareness 104 – Climate Indicators, Introduction


Reviewing recent climate annals to establish a sense of perspective on present climatic events is valuable, but two haphazard efforts made it clear that such a year-to-year history means most if the accounts are consistent, with the same climate indicators. Before returning to them it's worth spending some time on the main lines of evidence and natural occurrences which scientists use to help explain climate change.

NOAA has a list of Essential Climate Variables (ECVs), measurable aspects of the climate which are monitored around the world. They have consistent enough spatial coverage and to provide an intelligible picture of the world, and have been collected for long enough to provide meaningful information on trends. A partial list of ECVs (presently there are 54, most of which can be tracked by satellite):

  • Atmospheric surface: Air temperature, precipitation, air pressure, water vapor, wind speed and direction, radiation budget;

  • Atmospheric upper air: earth radiation budget, temperature, water vapor, cloud properties, wind speed and direction, lightning;

  • Atmospheric composition: carbon dioxide, methane, ozone, nitrous oxide, various hydrocarbons, aerosols, aerosol precursors;

  • Ocean surface: temperature, salinity, sea level, sea ice, currents, sea state, wind stress, heat flux

  • Ocean subsurface: temperature (used to calculate heat content), salinity, currents;

  • Ocean chemistry: inorganic carbon (i.e. dissolved CO2), oxygen, nutrients, nitrous oxide, color (monitored but not widely enough to be an ECV: pH);

  • Ocean biology: marine habitats, plankton;

  • Cryosphere: ice sheets & ice shelves, snow cover, glaciers, permafrost;

  • Biosphere: land cover, above-ground biomass, albedo, fire, land surface temperature, soil carbon;

  • Hydrosphere: river discharge, lake level, groundwater, soil moisture, ground evaporation.

The list expands with time as improved methods, spatial coverage and dataset age increase. One of the basic tenets of environmental monitoring, for global warming or anything else, is to have self-consistent data streams, and as many as possible well-distributed spatially, to allow for meaningful comparison over time. The list of ECVs is absolutely central to that, and it includes what is called the “backbone of climate change science”, surface atmospheric CO2 concentration.

A small subset of these variables will be discussed in the State of the Climate summaries.

Tomorrow: ocean oscillations which affect climate 1: a quick review of El Niño (ENSO).

Be brave, and be well.

ECVs in greater depth

365 Days of Climate Awareness 103 – State of the Climate 2011


Continuing with the joint annual AMS/NOAA worldwide climate report, 2011, while above the 1981-2010 surface temperature average, was not among the very warmest. The year began and ended in La Niña phases, which correlates with rainfall in Australia and cooler-than-usual temperatures across the northern Pacific. Air temperatures across North America, northern Europe and northern Asia featured several hot spells.

Despite the  La Niña events, sea surface temperatures globally were above average, but hurricane activity, outside of the North Atlantic, was not. Rain and snowfall were above average in the southern hemisphere, while droughts occurred throughout the northern. In November, a large cyclone moved north into the Bering Sea between Alaska and Russia,bringing with it a massive pulse of warm water and winds which broke up a large swath of sea ice nearly two months into the ice-gain season.


Top: Ocean heat content change, to 700 m, from 1993 to 2010. Bottom: with 95% confidence scale applied (color intensity displays statistical significance).  

The oceans continued their trend of becoming saltier in evaporative regions (such as the eastern Mediterranean and northern Indian Ocean and Red Sea), and fresher in rainy regions such as the northern Pacific. This indicates that the rate of the global water cycle is increasing. Though tropical sea surface temperatures were cooler than usual, in both north and south mid latitudes, the sea surface was significantly warmer than average.

Arctic annual max/min sea ice extents, 1978-2011.


The record of ocean heat content, measured via satellite and drift buoys down to roughly 700 m, is not nearly as complete as air and sea surface measures. For that reason only longer-term trends across portions of the entire ocean can be identified with much confidence. Cooling occurred primarily in the eastern Pacific and southwestern Atlantic, with warming trends, very strong especially in the northern Atlantic and western Pacific, happening nearly everywhere else.

Arctic sea ice cover continued its progressive disappearance, with both the annual maximum in March and the September minimum below the longer-term trend. Ice melt in Antarctica increased, happening over a larger area, mostly along the coasts, with little melting in the interior. Sea ice extent began the year at roughly an average level.A great deal of sea ice was lost in the southern Indian Ocean area,but was largely balanced by ice gain in the southern Pacific, both thought to be due to ocean current activity.

Tomorrow: introduction to climate indicators. (Because, it’s becoming clear: these year-by-year accounts will mean much more if I describe some of the major indicators discussed in the reports. Vivent les détours!)

Be brave, and be well.

365 Days of Climate Awareness 102 – 2010 State of the Climate


NOAA and the American Meteorological Society (AMS) have collaborated for a number of years on an annual State of the Climate Report, which tracks significant variables (such as ground level air and sea surface temperatures) and major ocean indices (such as El Niño/Southern Oscillation [ENSO], or the North Atlantic Oscillation [NAO]). The reports are a series of articles on features of interest from the year in question, whether it be extreme weather events, sea ice, large temperature anomalies, or otherwise. We begin here with the year 2010 and will move forward to 2020 in future posts.


2010 Surface temperature and precipitation anomalies.

At the time of publication (June 2011), 2010 was the warmest year on record (though estimates vary based on the method). Now, it ranks eighth. A strong El Niño event occurred at the year’s start, followed by a strong La Niña at the year’s end. Air temperatures lag the Niño/a events by several months, so early to mid-2010 featured the globally warm air temperatures which follow El Niño. The cooler La Niña phase of weather followed in 2011.

The Arctic Oscillation [AO], an index which compares air pressure in the Arctic to pressure in the northern Pacific and Atlantic Oceans, was very negative, meaning lower Arctic pressure and higher pressure in the Pacific and Atlantic. In this condition the polar vortex meanders farther south, bringing cold air to southern Europe and North America. 2010 was a negative phase, causing lower temperature throughout the northern hemisphere.

Temperature rises, measured  by temperature anomaly, were very high in northern North America, Africa and central Asia. The tropics and southern hemisphere show a much lower effect. Precipitation records on land are spottier but show drier conditions throughout Asia, northern Africa and southern South America, and wetter than average in the United States, Europe and Central America. Methane concentration in the atmosphere increased by about 5±2 ppb to roughly 1780 ppb, while carbon dioxide increased about 1.5 ppm to 385 ppm.

Tomorrow: 2011 state of the climate.

Be brave, and be well.

365 Days of Climate Awareness 101 – The Limits to Growth, 30-year update


Twenty years after publishing the landmark world modeling study “The Limits to Growth”, Donella Meadows and her system dynamics team composed a second edition, “Beyond the Limits”. This book examined evidence from around the world that physically humanity was already in overshoot, extracting too many resources and polluting at too high a rate for the planet to support. In 2000 they set themselves to re-evaluate the global state of affairs against the 1972 model results. Not to answer an overly simplistic, “Was the book right?”, but to examine how well the World3 model compared to three decades of events.

“[W]e can report that the highly aggregated scenarios of World3 still appear, after 30 years, to be surprisingly accurate,” Meadows wrote in the preface. Many parameters, such as population (6.0B, up from 3.9B) and annual grain equivalent production (3.0B, up from 1.8B) matched actual data well.  “Does this correspondence with history prove that our model was true? No, of course not. But it does indicate that World3 was not totally absurd; its assumptions and our conclusions still warrant consideration today.”

The book summarizes the philosophy behind the original, at times illustrating it with newer concepts. The problem of overshoot is described, along with the driving force—exponential growth—behind it. Then it describes the limits: sources (of resources) and sinks (for our waste products). After detailing the World3 model and its results, it tells a success story, how we, collectively among nations, dealt with the global problem of the Antarctic ozone hole (acid rain is another success story). The book then moves to present challenges facing us, and the fitness of the capitalistic free market to confront them, and later moves on to the future, and how we as a race might achieve sustainability.

Economist Arthur Daly identified three rules of economic sustainability. Those are:

  1.    Renewable resources: rate of consumption cannot exceed the rate of replacement;
  2.    Nonrenewable resources: rate of consumption cannot exceed the rate at which it can be replaced by a renewable alternative;
  3.    Pollution: rate of emission cannot exceed rate at which it is absorbed, recycled, or rendered harmless.

Another useful supporting concept, made popular by ecologist Arthur Wackernagel is that of the “ecological footprint”, estimating the amount of land needed to support a given activity. He estimated that, in 2000, humanity required 1.2 earths to support its current level of consumption.

The book ends hopefully, pointing ways forward to sustainability, though without any assurance we will achieve it. We are now approaching the 50th anniversary of the original book, and our overall ecological footprint is estimated to be about 1.7 earths. Despite global decades-long conversations about the problem, we have backslid by nearly 50% from 2000 in the drive toward sustainability.

Tomorrow: brief states of the climate 1: 2010.

Be brave, and be well.

365 Days of Climate Awareness 100 – The Limits to Growth


In the early 1970’s the Club of Rome, an informal group of international people of business, government and academics, commissioned a group of system dynamicists to model the planet as a natural and societal system, to develop some sense of the trajectory of global society in decades to come. Leading the team was an MIT professor, Donella Meadows. Their results were published in 1972’s “The Limits to Growth”, a short book which hits all the harder for its simplicity. They found that humans, in terms of population and the physical costs of the global economy, were headed toward overshoot of the planet’s carrying capacity, and faced the likelihood of a devastating 21
st-century economic and population crash. 

World3 model interconnections.

The book became a worldwide bestseller and faced furious attacks over the years to come. Most of those were simply outrage at the thought of any limits at all on sunny optimism, cloaked in nitpicking about particular aspects of the book’s argument, such as assumptions of linear depletion of resources (which were never intended to be predictions). The argument of the book is not that mineral resources were going to dwindle smoothly to zero. The argument lies in the dynamics of a complex system, with a mindbending array of feedbacks, both positive and negative.

World3 model, standard run.


The crux of the system’s behavior lies in two main behaviors. First is the difficulty of obtaining increasingly scarce resources, where they are not zero, but are more costly in terms of capital and environmental destruction to obtain (example: peak oil). Second is the increasing degradation of the environment, which becomes less healthy for humans and most life as we know it, and introduces problems which require increasing amounts of capital to remediate (examples: Superfund sites, and, of course, global warming).

World3 model, doubled reserves.


If economic growth is not moderated within the model, under the assumption of intelligent planning, it predicts a dramatic overshoot and crash of economic activity and population between the fourth and sixth decades of this century. Over multiple runs, the Meadows team doubled and more the available resources. This did not change the system’s behavior. On the contrary, increased resources merely pushed the peak a little further into the future, and worsened the crash.


It is fear and outrage at this overshoot-then-crash prediction which led to an almost pathologically ferocious backlash which lasted generations but did not address its fundamental soundness. In the United States this pathology contributed to the election, at the critically worst possible moment, of the politically gifted but unintelligent optimist Ronald Reagan, who categorically denied any sense of responsibility of humans to the planet we inhabit.

Tomorrow: Limits to Growth revisited (30-year update).

Be brave, and be well.

Text of the book

365 Days of Climate Awareness 98 – COP 26


The United Nations Framework Convention on Climate Change was negotiated in 1992 and went into force in 1994.It specifies that all parties will meet annually to address mitigating global warming. The first such Conference of Parties—COP--was held in Bonn in March, 1995. It has been an annual event since then, including this year's COP 26 in Glasgow, Scotland, concluded last Friday, November 12.

This particular conference was looked at as more important than several previous for two main reasons. First, the 2015 Paris Agreement states that parties will assess their own compliance with their greenhouse gas reduction goals every five years, beginning in 2021. The assessments are underway now and will be made public in 2022, so this year marks the treaty’s first milepost. Second is that with the election of Joe Biden to the presidency, official US policy is no longer to ignore the problem, so hopes were reasonably high for progress.

The conference, which ran one hour short of the 2015 Paris meeting, produced an agreement known as the Glasgow Pact (by the terms of the framework convention, these agreements negotiated at COPs are formal addenda to the main treaty).The Glasgow pact is divided into eight sections: (1) Science and urgency; (2) adaptation; (3) Adaptation finance; (4) Mitigation; (5) Finance and technology transfer: (6)  Loss and damage; (7) Implementation; (8) Collaboration.

Not attending were Brazil's Jair Bolsonaro, Xi Jinping of China, Vladimir Putin of Russia, and the national heads of Iran, South Africa, Japan and Mexico. While these countries did send delegations, the leaders' absence has been interpreted as a lack of urgency or outright dismissal of the conference's aims. Furthermore, several national delegations, including Russia's, Canada's and Brazil's, included fossil fuel lobbyists.

Though not an official delegation, collectively, the oil industry was the best represented group, with 503 attendees, more than the next-best-represented, Brazil, with 479. Lobbyists  outnumbered indigenous leaders from around the world by more than two to one. This is a very visible sign of how thoroughly the fossil fuel industry has co-opted action on global warming. In short, the foxes still control the henhouse.

Tomorrow: the 2021 Glasgow pact.

Be brave, and be well.

Text of the Glasgow Pact

365 Days of Climate Awareness 99 – The 2021 COP 26 Glasgow Pact


The seven sections of the 2021 Glasgow Pact are: (1) (1)Science and urgency; (2) adaptation; (3) Adaptation finance; (4)Mitigation; (5) Finance and technology transfer: (6)  Loss and damage; (7) Implementation; (8) Collaboration. The aim of the entire conference, as well as the final document, was set within the parameters of the 2015 Paris Agreement. However, input from small, poorer countries—those which tend to be more at risk from global warming—was little or nothing.

There is no lack for excellent commentary on the conference as it proceeded and in its wake, at Daily Kos and elsewhere. There are dozens of superb diaries by some excellent writers including boatsie, Angmar, Pakalolo and others), and other sources of excellent commentary. I'm not going to try to repeat, in a few sentences, what so many others have already written so well and at greater length. It's worth investing the time to go exploring

I don't know how many shared my sense going into this conference that nothing important would change. My feeling after its conclusion is no different. No resolutions of any importance, concerning abandonment of coal and phase-out of hydrocarbons, were made. The wealthy nations of the G20 made no firm pledges to the poorer nations facing increasing levels of destruction from rising seas and temperatures.

If there's one sense of hope I have, it's somewhere between amorphous and concrete. And it's on the level of peer pressure between nations.Aside from the ten-page Pact, a number of statements of more limited scope were issued, on topics such as zero-emissions vehicles,aviation, shipping, agriculture and transitioning to renewable energy.  To an extent these statements, which had far from unanimous approval among attendees, are just more lip service.

But the onus is shifting. Quickly enough? We'll find out soon. Articles 25-34 of the Pact, in section 4 (Mitigation), urge parties to increase their greenhouse reduction ambitions (Australia has already refused) and pledge increased reporting. My cause for hope? Sunlight, on a global scale. This conference held the attention of people from around the world, and most of those people are upset at the lack of progress. At the highest official levels, institutional weakness—the UN has no power to infringe on members' sovereignty, and democracies are not command economies—inhibits most progress. What can drive progress? The outrage of billions, and our collective market power. We face significant obstacles, including a wealthy and organized petroleum industry and growing authoritarian movements in every democratic nation.

There's another, deadlier, threat even behind global warming, one just as immediate and ignored still more glibly by even the most well-intentioned businesspeople and politicians: our headlong race toward the carrying capacity of a finite planet. Acknowledging the need to shape local, national and international policy toward the premise of an economy which plateaus and then shrinks, in a manageable way, is absolute anathema on almost any political spectrum. But I fear that, for all of our concern over global warming, we as a global society are like a middle-aged person diagnosed with a severe heart issue, needing to make significant lifestyle changes to have reasonable hope for another decade or two...all the while ignoring the lymphoma.

Tomorrow: the limits to growth.

Be brave, and be well.
COP 26 outcomes (not the Pact)

Daily Kos COP 26 diaries

Guardian COP 26 Stories

ECIU COP 26 stories

Heinrich Boll Stiftung Foundation diaries

365 Days of Climate Awareness 97 – Global Precipitation Anomaly


In IPCC literature, anomalies—departures from a baseline—are generally calculated versus the 1850-1900 average value, known as the “pre-industrial” era. Global precipitation is harder, however, because there’s no proxy data for rainfall over the ocean. The best we can do is use proxy data from land and extrapolate over the ocean using atmospheric models. Today’s precipitation anomaly plot shows the 1980-2019 average relative to the 1981-2010 average.

Precipitation is a function of many factors, but mostly water vapor content in the atmosphere. Air’s carrying capacity for water vapor increases with temperature. With increased global temperatures, water vapor content is likely to increase, and therefore precipitation, but it isn’t always that simple.

Global rainfall anomaly, 1980-2019.

Where heavy precipitation dries out the air, warmer temperatures can result in extremely dry air following major precipitation events. Moisture-laden air moving toward mountains is forced upward, cooling adiabatically. The vapor which condenses into droplets falls as rain or snow, leaving the air drier, so when it continues to move past the mountains and return to lower elevations, the air is now too dry for condensation to occur. This effect is called the rain shadow, and is reality on the lee (downwind) side of almost every mountain range on earth.

As mentioned in yesterday’s post on salinity, increased rainfall over mountainous and continental areas leads, without an influx of fresh moisture, to significant rain shadows. The intensity of rainfalls, and the severity of the subsequent desiccation of the air, are increasing. This is a factor in the phenomenon called “global weirding”, where established weather patterns are changing, and extreme events are becoming more common. So the added moisture in the atmosphere is not necessarily leading to increased gentle rainfall, but rather, increasingly intense, localized, frequently destructive downpours, and extended dry zones.

Tomorrow: overview of COP 26.

Be brave, and be well.


365 Days of Climate Awareness 96 – Ocean Surface Salinity Changes


Salinity is one of the basic aspects of the ocean which we track, for a number of reasons. Salt content affects the water's density, which affects its behavior in the thermohaline (density) current system. In some cases it can affect ecosystems. And, being a function primarily of evaporation and precipitation, it's a useful measure in climate change. Increased precipitation (rain and snow) lowers surface salinity; evaporation increases it.

Salt content in the ocean is effectively constant, since it does not evaporate and the input from rivers is insignificant by comparison. It's estimated that there are 5x10¹⁶ (50 quadrillion) kilograms of salt in the ocean,while rivers discharge about 3.6x10¹² kg of dissolved solids (i.e. salts) into the ocean each year. At that rate, it will take rivers nearly 14,000 years to double the salt content of the ocean.


We assume also that salt is well-mixed,meaning that it is evenly distributed around the global ocean. Local differences in salinity are contained within water parcels which either move or remain in one location, and exchange salt with their surroundings at their boundaries. There are no major point sources, as there are for pollutants like ozone and sulfur dioxide, which cause large-scale gradients.

We infer meteorological causes for the salinity gradients we do see, and over the longer term (>25 years), climatic causes. The IPCC has concluded in AR6 V1 that anthropogenic climate change has changed global precipitation patterns, on balance increasing overland rain and snow rates, and,with less confidence, over the ocean as well.

The plot shows this. In regions of the ocean already known for heavy rain, such as the equatorial band across the Pacific and in the northeastern Pacific near Alaska and Canada, precipitation rates have increased over the past seven decades. Meanwhile, east of major land masses—i.e. in the continental rain shadows—precipitation has decreased, due to the greater rainfall over land.

Large-scale weather pattern changes like this are, along with mean temperature increases and sea level rise, one of the top-tier changes effected by global warming. We will examine many aspects of weather pattern change over the remainder of the series.

Tomorrow: global precipitation anomalies.

Be brave, and be well.

Not-Quite-Daily Climate Awareness The Inflation Reduction Act of 2022

(It might take me a while to find a workable new title. Bear with me.) Now that US President Joe Biden has signed the Inflation Reduction Ac...