- Global atmospheric CO2 concentration: 405.22 ppm, +2.16 ppm from 2016
- Surface air temperature anomaly: +0.99°C/1.78°F, 1st all-time 1880-2021
- Precipitation 22.5 (0.4 in) mm below 1961-1990 global average 1033 mm (40.7 in)
- Global mean sea level 43.15 mm above 1993-2008 average, +2.16 mm from 2015
- Antarctic ozone hole: max. area 23.0 million km2; minimum O3 114 DU (Dobson Units)
- ENSO: Mostly neutral, weak La Niña early and late
- NAO: Alternating positive and negative
Global Conditions
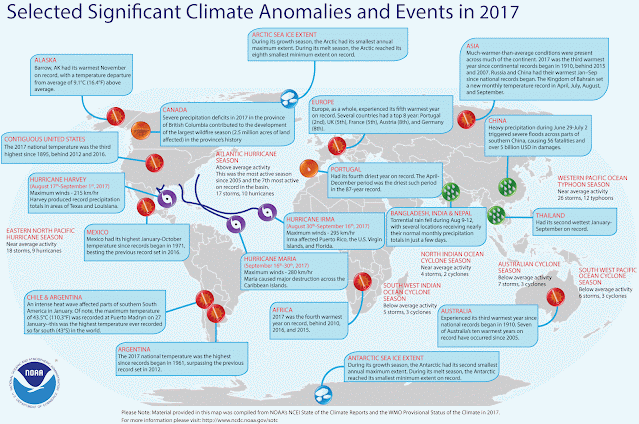
- Above-average temperatures: The Caribbean; northern and eastern South America; Africa; Indian Ocean islands; Europe; the Middle East; Russia; Mongolia; China; Japan; southeast Asia; India; Iran; Micronesia; Australia
- Below-average temperatures: southern South America
- Above-average precipitation: Northern & southern South America; northern Africa; eastern and southern Europe; Russia; Mongolia; China; Japan; Australia
- Below-average precipitation: Amazon Basin and eastern South America; sub-Saharan and southern Africa; Micronesia
The Arctic experienced a near-record warm year. As with eastern Antarctica, this can lead to increased snowfall, since during wintertime conditions are often too cold and dry for snow. The year began and ended extremely warm, with nearly average summer temperatures in between. The Arctic is warming at nearly twice the rate of lower latitudes—a process known as Arctic amplification.
There are several principal reasons for this: (1) reduced
albedo due to reduced snow and ice cover, both in time and spatial extent; (2)
increased atmospheric water vapor (due partly to increased warmth); (3)
increased heat storage in the Arctic Ocean; (4) decreased cloudiness in summer
(lower albedo) and increased in winter (insulative effect); (5) lower long-wave
heat loss relative to the tropics due to colder temperatures.
The Antarctic does not experience the same dynamics. Antarctic snow does not melt away like the snow in northern Canada and Alaska do, in austral summer, so its albedo remains consistently high. Since Antarctica is isolated from other continents by an oceanic ring, the continental mass remains cooler. And due to the global dynamics of the atmosphere, cyclone activity in the southern hemisphere is far lower than in the north, resulting in lower overall heat transport from the equator toward the south pole.
In 2017, the total ACE for the northern hemisphere was 487 x
104 kts2; for the southern hemisphere, it was 93 x 104
kts2. Using ACE as a measure, 60-75% of cyclone activity tends to
occur in the northern hemisphere, indicating a far greater heat transport from
equator to pole by major storms in the north than in the south. As the Ferrel
cells expand and pole-to-equator heat transport becomes more efficient, Artic
amplification is likely to grow even more pronounced.
Tomorrow: 2018 state of the climate, North America.
Be brave, and be well.


No comments:
Post a Comment