Yesterday's post on the normal distribution dealt with descriptive statistics, in its most basic forms: the central tendency (for randomly distributed data to cluster around a central value) and distribution (the standard deviation, or amount of spread). These are essential to the concept of confidence in observations.
For statistical analysis to have the most power, a control group, where no known change occurred, is needed for comparison to the test group (such as the placebo group in an experimental drug trial). The null hypothesis states that there will be no effect, no difference in the performance of the two groups. The trial is an effort to disprove that hypothesis.
In cases, such as in the environment, where finding a control group might not be possible, observations are generally compared to a baseline, whether the earliest observations made in that investigation, or observations made earlier and adopted for use. This is common in climate change research, where sparse data sets are used to calculate mean global temperatures for the 18th, 19th and early 20th centuries.
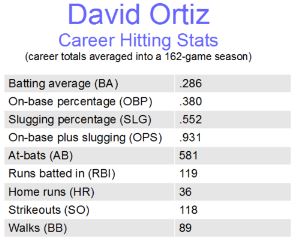
Descriptive stats can be displayed numerically or graphically. Sports fans are familiar enough with batting, shooting, completion and save percentages, points-per-game averages, and the like. And economic point, bar and pie charts are common. While sport stats are rarely faked, evaluating the source of environmental, social or economic data is often the primary task in determining how reliable the information is.
Tomorrow: inferential statistics.
Be well!


No comments:
Post a Comment