
- Global atmospheric CO2 concentration: 412.44 ppm, +2.37 ppm from 2019
- Average air temperature: 56.1°F, 5th all-time 1895-2021
- Average precipitation: 30.38”, +0.44” over mean
- Tornadoes: 1075 (preliminary count), 173 (14%) below the 1991-2010 average 1251
- 30 named tropical cyclones: 14 hurricanes, 7 major (winds > 111 mph, 3-5 Saffir-Simpson)
- Atlantic ACE: 194.59 x 10⁴ kts2 (1991 - 2020 mean: 108.7 x 10⁴ kts2)
- ENSO: Weak El Niño early, neutral in summer, weak La Niña late

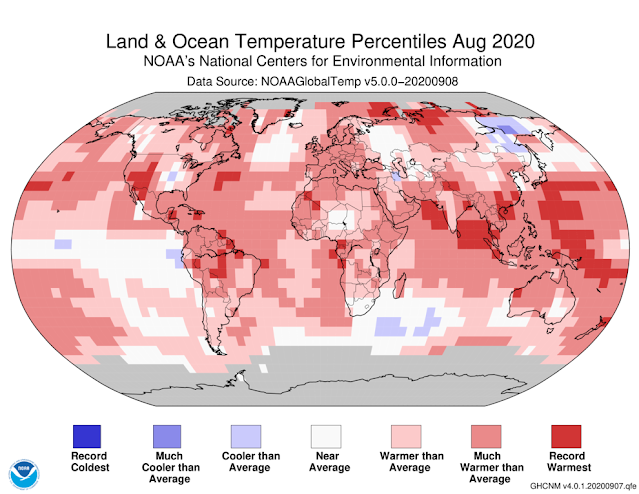
North American Conditions
- Warmer than average: Far northern Canada (northern archipelago); US (especially coastal & southern); Mexico
- Cooler than average: Northwestern Canada
- Drier than average: southwestern & upper Midwestern US; central and northern Mexico
- Wetter than average: southeastern US; southeastern Mexico
- Snow cover: 14.7 x 10⁶ km2 winter maximum vs 1966 - 2020 average 15.1 x 10⁶ km2
NOTE: for several posts running I posted the typo of 25.1 x
106 km2 as the
annual and mean maximum snow covers. Please pardon my late catch!

2020 was an extraordinarily active cyclone season in the North Atlantic, with storm counts well above and the ACE almost 80% higher than the long-term averages, second only to 2005 for overall severity. Neutral-to-La Niña conditions favored this. Nine of the storms were short-lived (dubbed “shorties” by meteorologists), lasting less than 48 hours at tropical storm (TS) or higher status before dissipating. Since 2000 the annual count of these shorties has increased by more than 5, but this is very likely an artifact of improved monitoring capabilities, since many satellite-based observational tools were not available before then. Time will tell if this trend is meaningful or artificial.

16 of the year’s 30 named storms developed in the Main Development Region (MDR), spanning the tropical Atlantic between Africa and the Caribbean. Three developed in November, and two became major hurricanes, versus only five major November hurricanes in the preceding 70 years. Sea surface temperatures (SSTs) were above average in both the equatorial, northwestern and north central Atlantic.


Tomorrow: the 2020 state of the world climate.
Be brave, and be well.


No comments:
Post a Comment