Greenhouse gas emissions have reached their highest levels in human history during the last decade. While emissions rates for the different gases (CO2; CH4; N2O, and others) vary, they have all trended upward. Population has continued to increase (5.3B in 1990, 7.9B in 2021) as have per-capita greenhouse emissions. The past decade’s CO2 emissions (2010-19, 410B tons) is roughly equivalent to allowable emissions from this point (2022) to 2050 to stabilize global temperature at the Paris Agreement goal of 1.5°C/2.7°F above 1750 levels.
All illustrations from the IPCC 6th Assessment Report, Vol. 3, Chap. 2. Anthropogenic greenhouse gas (GHG) emissions trends, 1990-2018.
Geopolitical and economic events, and GHG emissions.
24 countries have reduced their CO2 emissions for more than ten years at levels consistent with meeting the 2.0°C goal. However, they are minor emitters, and their total reductions are 3.2 GtC (gigatons of carbon) per year, however. The single biggest problem area for increasing greenhouse gas emissions is in consumption-based emissions in the developed (high per-capita GDP) countries. The largest increases have come in Asia and the developing Pacific region, where countries aspire to follow the economic growth pattern of the United States and Europe.
Breakdown of different GHG contributions to global warming. (FFI = Fossil Fuel and Industry; LULCUF = Land Use, Land Use Change and Forestry.)
Inventories of classes of GHGs, 1980-2015. (HFCs = Hydrofluorocarbons; HCFCs = hydrofluorochlorocarbons; PFCs = perfluorocarbons; CFCs = chlorofluorocarbons; SF6 = Sulfur hexafluoride; NF3 = nitrogen trifluoride.)
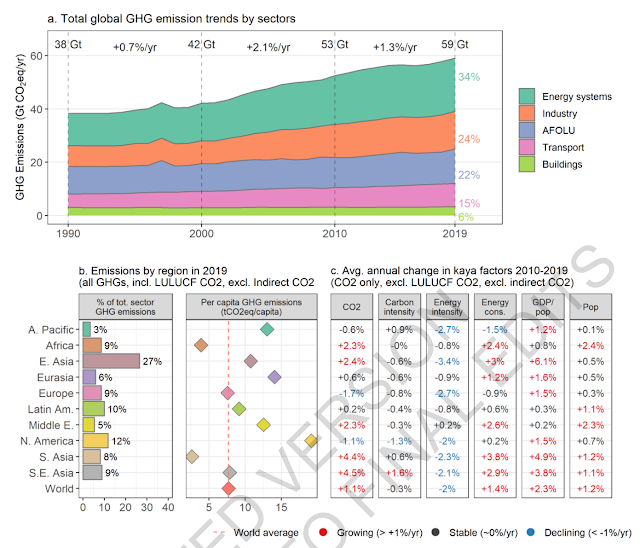
In the global aggregate, greenhouse gas emissions have increased over the last decade in all sectors, especially in industry and transportation. At the same time, the decadal average for growth in emissions for energy production decreased from 2.3% for 2000-2009 to 1.0% for 2010-2019. This is attributed to increases in plant efficiency and the global spread of renewable energy. The increase in industrial greenhouse gas output is thought to be due to rising global demand for goods and services.
Long-term GHG emissions trends.
Air pollution, 1970-2019 (CEDS and EDGAR databases).
Extending current energy production to the remainder of the undeveloped world would increase global emissions by 2-3%. Meanwhile, renewables development is proceeding, but only at the national or, at most, regional level, not globally. Even so, many energy transition projects, from high- to low-carbon—have begun around the world and indicate that such a transition is possible on a global scale, with sufficient will. However, it is estimated that the wealthiest 10% of the global population account for anywhere from 36-45% of greenhouse gas emissions, due to carbon-intense lifestyles (especially regarding transportation).
Recent regional changes in GHG emissions.
Emissions by economic sector.
At current decarbonization rates, the planet will miss the 1.5°C target, but carbon trading programs and other policy-based approaches do have the potential to change this. Such policies, such as carbon taxes and trade programs have already helped slow the growth of emissions. More aggressive use of those in years to come could prove pivotal in keeping global warming below 2.0°C or, ideally, the Paris Agreement goal of 1.5°C.
Emissions, relative changes, per capita and economic carbon intensity. (AFOLU = Agriculture, Forestry and Other Land Use.)
Trends by sector and region.
Tomorrow: mitigation pathways consistent with long-term goals.
Be brave, be steadfast, and be well.


No comments:
Post a Comment