4 billion out of the world’s population of 7.9 billion, or 51%, currently endure water scarcity for at least one month out of twelve. It has been found, with a high level of confidence, that global warming has accelerated the water cycle worldwide, and this has contributed to water scarcity problems. (Another factor is privatization of resources.) This acceleration has generally taken the form of wet areas growing wetter, and dry areas drier.
From the IPCC's 6th Assessment Report, Vol. 2, Chap. 4. The global water cycle.
From the IPCC's 6th Assessment Report, Vol. 2, Chap. 4. Global water scarcity.
Global warming has been connected with a high degree of confidence to extreme weather events around the world. Drought, destructive and extended rain, and storms are growing more frequent and more severe. This shift is changing the statistical record, where previous “century events”—those events severe enough that according to statistical models, they should occur once every hundred years—are becoming much more regular. Droughts in particular, though only 7% of extreme weather events from 1974 to 2019, have been responsible for 34% of all disaster-related deaths (mostly in Africa). Floods have become more intense over the past 60 years as well, accounting for 31% of all disaster-related economic losses in that time.
From the IPCC's 6th Assessment Report, Vol. 2, Chap. 4. Global precipitation trends, 1950-2018, for: (d) Boreal winter (austral summer); (e) Boreal summer (austral winter) (f) Rx1day: single-day (not extended) events; (g) consecutive dry days (CDD); (h) population density in 1-day event regions; (i) population density in areas with CDD events.
Droughts and floods have had a heavy impact on global agriculture and energy production. Drought-related crop losses between 1983 and 2009 have approached $200B in the US alone, and they have also reduced the effectiveness of hydropower, causing a 5% decline in generator utilization over the past forty years.
From the IPCC's 6th Assessment Report, Vol. 2, Chap. 4. Global river flow trends. Left column: historical flow. Center column: modeled pre-industrial (to 1750) flow. Right column: Modeled changes 1750-present. Top row: flow rates during low-flow events. Middle row: average flow rates. Bottom row: flow rates during flood events.

From the IPCC's 6th Assessment Report, Vol. 2, Chap. 4. Global river flooding risk.
Changing land use, as more regions are industrialized (including for large-scale agriculture) or exploited (like the Russian taiga for its wood) has degraded many fresh water sources around the world. Reduced flow, due to water consumption, and pollution of what remains tend to have a disproportionate impact on poorer countries located downstream of the consumers and pollution sources.
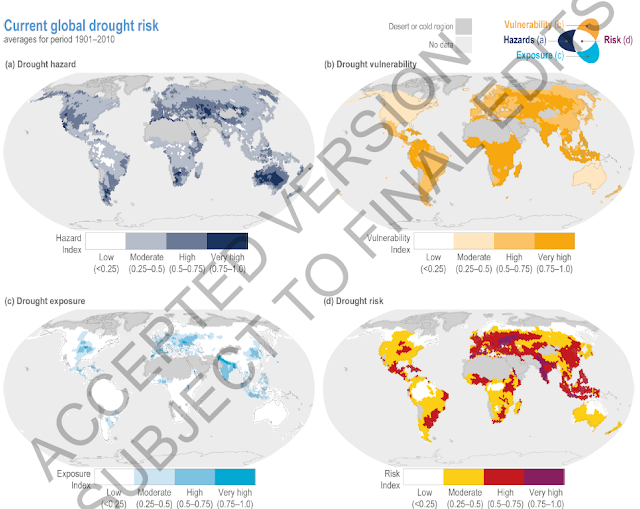
From the IPCC's 6th Assessment Report, Vol. 2, Chap. 4. Global drought risk.
These problems—scarcity, agricultural and water quality impacts—are expected, with high confidence, to worsen with every degree of increased global temperature. The effects will not be spread evenly, however. By 2100, 33% of major run-off (meltwater) river systems are expected to experience a 10% or higher decline in flow. This will adversely affect all regions and people which depend on the water (none more than the delta regions which need the regular throughput to maintain themselves). Further, by 2050, anywhere from 40% to 80% of the world’s rivers will experience critically low water levels on an annual basis as rainfalls become more erratic.
Tomorrow: Food, fiber, and other products.
Be brave, be steadfast, and be well.


No comments:
Post a Comment