Sunday, July 31, 2022

365 Days of Climate Awareness 353 – AR6 Vol. 3, Chap. 9: Buildings


In 2019 buildings accounted for 12 GtCO2eq, or 21% of the world total for greenhouse gases (GHGs), 31% of CO2 emissions alone. Of this, 57% was due to offsite generation of heat and electricity, 24% was emitted on site and 18% due to the use of concrete (which emits CO2 as it cures) and steel. In examining the role of buildings and remediating them in the climate crisis, it is worthwhile to change the focus from efficiency, or obtaining more from less, to sufficiency, or allocating available resources as equitably as possible.


All illustrations from the IPCC 6th Assessment Report, Vol. 3, Chap. 9. SER (Sufficiency, Efficiency and Renewables) agenda as applied to the building sector. 


Sufficiency interventions and policies in the building sector. 

Improvements in efficiency have typically still led to increases in overall consumption, especially of space. The concept of sufficiency addresses per-capita use. In the case of buildings, limiting per-capita space consumption in living quarters, work environment and recreation acts to limit the size and spread of construction, which will help to reduce the climate impact of urban areas without other technological improvements or social change.


Building services.


Global and regional GHG emissions change over time, broken down into emissions sources.

Retrofits of more efficient equipment and materials on existing buildings will have an impact, but the largest mitigation effects are likely to be felt in the realm of sufficiency design. Buildings more crafted more ecologically and ergonomically will be smaller in both size and environmental impact. Models show potential emissions cuts by 2050 as high as 85% in Europe and North America, and from 40-80% in the developing world.


Global and regional per capita emissions, historical data and scenarios.  


Global emissions reductions in the buildings sector under various scenarios. (Dark green bars represent residual emissions at 2050 after all mitigations in that scenario have been performed.)

The cost for remediation and more advanced design, particularly in the developing world, is one significant impediment to achieving those maximal scenarios. Another is the varying strength of governments around the world. Particularly in developing countries, weak central governments lack the ability to set and enforce sufficiency development policies. If these barriers can be overcome, the Sufficiency, Efficiency and Renewables (SER) agenda in building construction would improve human existence in several ways. It would lower raw emissions globally, for decades at least; it would create more climate-resilient buildings worldwide, needing less repair and restoration after extreme events; and it would improve the living conditions of the people in them.


Regional emissions reductions in the buildings sector under various scenarios. (Dark green bars represent residual emissions at 2050 after all mitigations in that scenario have been performed.)

Tomorrow: transportation.

Be brave, be steadfast, and be well.

IPCC 6th Assessment Report, Vol. 3, Chap. 9

Saturday, July 30, 2022

365 Days of Climate Awareness 352 – AR6, Vol. 3, Chap. 8: Urban Systems and Other Settlements


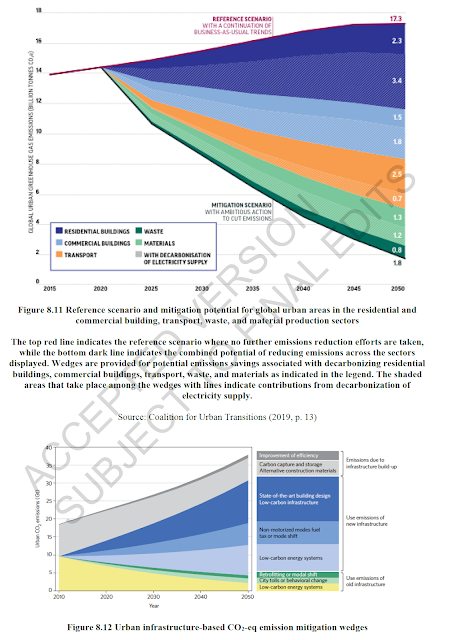
Cities have typically been the result of growing wealth in a society. Now they represent opportunities to decarbonize at scale, and just as importantly, ahead of anticipated rapid 21st century growth in developing countries, where with current methods, per-capita greenhouse gas (GHG) emissions are likely to increase. It is estimated that in 2015, cities around the world were responsible for 24.5 GtCO2-eq (gigatons of CO2 equivalent), or 62% of the world total. The 100 largest urban areas on the planet account for about 18% of all GHG emissions.


All illustrations from the IPCC 6th Assessment Report, Vol. 3, Chap. 8. Urbanization versus Gross National Incomes (GNI). 


2018 world population: rural versus urban.

The urban share of GHG emissions increased from 56% to 62% between 2000 and 2015, though this increase was unevenly distributed around the world, occurring more in developing regions where cities have been rapidly growing.  The same was observed in per-capita urban emissions, where the largest increase occurred in developing countries as they built out their infrastructure. Both trends are expected to continue, and represent one of our largest opportunities for mitigation.


2015 urban per capita GHG emissions. 


2050 and 2100 forecasts for urban emissions. [SSP1: Sustainability (Taking the Green Road); SSP2: Middle of the Road; SSP3: Regional Rivalry (A Rocky Road); SSP4: Inequality (A Road divided); SSP5: Fossil-fueled Development (Taking the Highway)] 

Many cities are built in vulnerable locations, at low elevation, along coasts and rivers. Furthermore, most developing nations are themselves particularly vulnerable to global warming, being in or near the tropics. For these reasons mitigation and adaptation strategies must be combined, achieving not only low-carbon energy sources and efficient uses, but also employing flood protection and more ecologically-minded freshwater delivery systems.


Mitigation potentials to 2100. 

Decarbonizing cities will require large-scale transformations of existing systems, in three main efforts:

  1.   Reducing energy consumption in all sectors;
  2.   Electrifying as much as possible and switching to zero-carbon energy sources;
  3.   Enhancing carbon uptake (i.e. planting trees).

Cities cannot effectively decarbonize by focusing only on emissions within their city limits. Taking supply chains and out-of-city residents into account, efficiency and no-carbon energy sourcing must reach beyond the city’s limits to be effective.


Emissions mitigation scenarios. [SSP1: Sustainability (Taking the Green Road); SSP2: Middle of the Road; SSP3: Regional Rivalry (A Rocky Road); SSP4: Inequality (A Road divided); SSP5: Fossil-fueled Development (Taking the Highway)] 

It will be easier to build low- and no-carbon systems in still-developing cities than to convert existing metropolitan areas, though the problem will be funding in those typically poorer (still developing) nations and the political and social will to dramatically change development plans. Restructuring existing cities, even where money to invest exists, will require huge political and social efforts. But the potential in creating more ecologically-minded green and blue spaces within cities, and replacing existing infrastructure with more efficient and lower-carbon sources, could reduce GHG emissions by 23-26% by 2050.

Tomorrow: buildings.

Be brave, be steadfast, and be well.

IPCC 6th Assessment Report, Vol. 3, Chap. 8

Friday, July 29, 2022

365 Days of Climate Awareness 351 – AR6 Vol. 3, Chap. 7: Agriculture, Forestry, and Other Land Uses


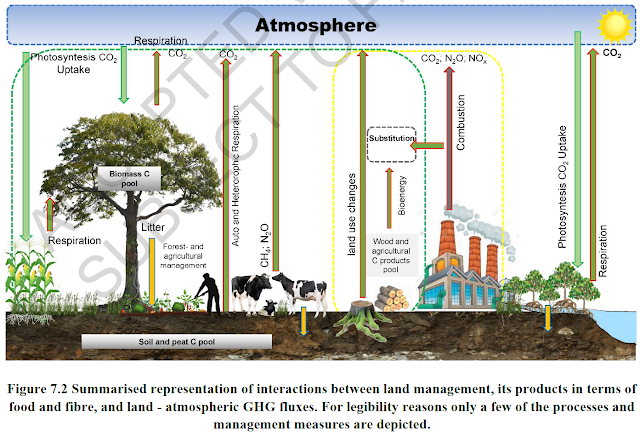
These three designations: agriculture, forestry, and other land uses (AFOLU): refer to managed ecosystems, and they have the potential to significantly lower global warming.  Focusing strictly on carbon dioxide, the land itself is a net carbon sink, but the industries accounted for about 5.9 ± 4.1 GtCO2 yr-1, anywhere from 13-21% of total global emissions. Managed forests and farms are estimated to absorb 12.5 ± 3.2 GtCO2 yr-1, leaving a net negative of 6.6 ± 5.2 (yes, that is a very large uncertainty) GtCO2 yr-1.


All illustrations from the IPCC 6th Assessment Report, Vol. 3, Chap. 7. Managed land use and the carbon cycle.


Global Agriculture, Forestry, and Other Land Use (AFOLU) CO2 flux.  

The bulk of land-use change emission (45%) comes from deforestation. In recent years the rate of deforestation has decreased, but is far from stopping, and information is not always reliable (such as from Russia’s eastern taiga). Emission of other greenhouse gases are primarily of CH4 (4.2 ± 1.3 GtCO2eq-yr-1) from ruminants (cattle and other livestock), and NO2 (1.8 ± 1.1 GtCO2eq-yr-1) from the application of fertilizers and manure.  But land-use change has not been uniform around the globe, with net loss occurring in the tropics and net gains, where they happen, regionally in the subtropical and sub-arctic regions of the north.


Global and regional trends in AFOLU CO2 flux.

AFOLU-related CH4 and NO2 flux.

It is estimated that the AFOLU sector can provide 25-30% of the emissions mitigation necessary by 2050 to achieve 1.5°C/2.7°F warming. The largest part of this would be through restoring forests, wetlands, peatlands and grasslands: expanding the organic carbon sinks, essentially, as easily the most efficient form of carbon capture we have. An average of models shows these methods reducing emissions by 7.3 (3.9-13.3) GtCO2eq-yr-1. (The confidence interval is uneven because the distribution of model results is skewed, and does not follow the bell curve.) The second major sphere of reductions will be from agriculture. More sustainable cultivation methods and adjusting the diet of livestock (to limit methane emissions) could reduce emissions by 4.1 (1.7-6.7) GtCO2eq-yr-1. Demand-side changes, including behavioral changes such as healthier, more sustainable (i.e. less beef and fat) diets and building with more wood and less metal and concrete, could reduce emissions by 2.2 (1.1-3.6) GtCO2eq-yr-1.


Regional AFOLU GHG fluxes.

There are significant social, political and economic hurdles to these solutions, not the least being their highly regional nature. Those parts of the world which specialize in one type of food production (rice or beef, for example) will be disproportionately affected by changes to that particular industry. Furthermore, demand-side changes involving people’s diets and activities will be resisted without effective public campaigns. A disappointing fact on this front is that solutions of this nature have been well known for decades but little or no progress has been made on them.

Regional mitigation by greenhouse gas needed by 2050 and 2100 for four warming scenarios (1 . 5°C, 2°C, 3°C and 4°C). 


Regional mitigation needed by type of use by 2050 and2100 for four warming scenarios (1 . 5°C, 2°C, 3°C and 4°C). 

Tomorrow: urban systems and other settlements.

Be brave, be steadfast, and be well.

IPCC 6th Assessment Report, Vol. 3, Chap. 7

Thursday, July 28, 2022

365 Days of Climate Awareness 350 – AR6 Vol. 3, Chap. 6: Energy


In order to meet the Paris Agreement target of 1.5°C/2.7°F temperature rise over 1750 levels, global output of CO2 from the energy industry will need to decline 35-51% relative to the present, and all greenhouse gases (GHGs) 38-52%, by 2030. By 2050 the drops will need to be 87-97% for CO2,  60-79% for all GHGs. This transition must be made on both the supply side (generation) and the demand side (consumption). Among fossil fuels, coal use must drop from present levels by 67-82% by 2030.


All images from the IPCC 6th Assessment Report, Vol. 3, Chap. 6. Retirement of coal plants needed to meet Paris Agreement goals.


Capacity increase in wind and solar power in recent years.


Onshore and offshore wind cost, capacity and LCOE.

The IPCC lists seven components essential at the national level to energy decarbonization:

  1.  Gross-zero or net-negative-CO2 electricity production systems;
  2. Widespread electrification of end uses, including light transport, heating and cooking;
  3. Substantially reduced fossil fuel use relative to today;
  4. Use of alternate engine fuels instead of gasoline and diesel, like ammonia, hydrogen and bioenergy;
  5. Greater general efficiency in all phases;
  6. Greater system integration for larger-scale efficiencies;
  7. Carbon capture and storage.


GHG emissions by sector in recent years. 


Global primary energy (energy as found in nature, not yet converted for human use) and consumption. 

GHG emissions changes in recent years. 

Two hopeful signs are the worldwide drop in price for renewable energy (Levelized Cost of Energy—LCOE, the expected price per unit energy, in today’s dollars, over a project’s lifetime), and the dramatic increase in global renewables capacity. Between 2015 and 2020, the LCOE for photovoltaic (PV) power generation has dropped 56%, wind power 45%, and batter storage 64%. Meanwhile from 2015 to 2019, PV capacity increased by 170% (to 680 TWh), and wind by 70% (to 1,420 TWh). In that span, hydropower capacity grew by 10% to 4,290 TWh, and nuclear capacity by 9% to 2,790 TWh. That year the planet consumed 22,848 TWh of electricity. Renewables produced 28% of that, and low-carbon (renewables plus nuclear) accounted for 37% (up from 34% in 2015).


Drivers of GHG emissions around the world. 

Projected energy sector GHG emissions for 1 . 5°C scenarios.


Projected emissions reductions by region and sector to meet Paris Agreement goals.

A popular term in consulting and industry circles today is “disruption”, and that will be one inescapable result of a rapid shift away from fossil fuels. The fossil fuel industry resists, existentially, all movement toward stranding oil, gas and coal assets in the ground (reminding you again of the $56.25T, at $75/barrel, to be made from remaining reserves). Shifting from carbon-intensive to low-carbon or carbon-free alternatives will change investment patterns, in some cases catastrophically, but also opening up a range of new alternatives for countries around the world, regions with significant renewable potential, and the people who live there. And the goal is to provide energy both equitably and sustainably for the entire world population. In this sphere, nationalistic governments pose as very live a danger as the fossil fuel industry to progress on climate change.


Projected decrease in emissions by sector to meet Paris Agreement goals. 

Projected changes by energy source to meet Paris Agreement goals. 


Schematic of a carbon-neutral economic system. 

Tomorrow: agriculture, forestry, and other land uses.

Be brave, be steadfast, and be well.

IPCC 6th Assessment Report, Vol. 3, Chap. 6

Wednesday, July 27, 2022

365 Days of Climate Awareness 349 – AR6 Vol. 3, Chap. 5: Demand, Services and Social Aspects of Mitigation


Changing the demand side—reducing consumption—should theoretically be the easiest method to reduce greenhouse gas emissions. However, this is called into some question given the IPCC estimate that 36-45% of all emissions are due to the lifestyles of the planet’s wealthiest 10% (slightly under $100,000 net worth, according to one estimate. About 102 million Americans—a little less than a third of the country’s population—are among this group.)


All images from the IPCC 6th Assessment Report, Vol. 3, Chap. 5. Per-capita energy use around the world, with countries grouped by socioeconomic development. 

The IPCC’s models predict that 40-70% of emissions cuts by 2050 could be made on the demand side. This seems easier because it does not require the buildout of entire new industries like revamping energy production and industry do. However, the social inertia in reducing consumption so sharply could prove to be no less a challenge than systemic technological improvement.


Components of reducing global demand by 2050. 

Digitizing services alone has not reduced energy consumption in all cases, because improved speed in service is offset by increased energy use by the computer systems. Improved efficiency in the data systems themselves will do more than merely digitalizing to genuinely reduce the carbon footprint of many service industries.


Socioeconomic aspects of current and modeled (equitable) 2050 demand.  

Though an equitable approach to climate change requires the wealthiest to make proportionately larger cuts in their consumption, the intended outcome—reduction in demand—cannot fail to negatively affect sectors of wealthier nations’ economies. Since reduced demand is one symptom of recession, that danger is very real in this course of mitigation. Social movements designed around behavioral change and shared sacrifice for the sake of common goals are an important component in this strategy.

\
\
Toward a more equitable society.

Tomorrow: energy systems.

Be brave, be steadfast, and be well.

IPCC 6th Assessment Report, Vol. 3, Chap. 5

Tuesday, July 26, 2022

365 Days of Climate Awareness 348 – Net Zero


Net zero is the concept of balancing inputs of greenhouse gases into the atmosphere with their removal, resulting in no net gain, and therefore, no radiative forcing—no planetary heat gain. The terms “net zero” and “carbon neutral” are often used interchangeably. Their meaning is similar, but net zero includes the other greenhouse gases like methane, nitrous oxide, and the whole range of fluorocarbons and others. “Decarbonizing the economy” is a convenient shorthand for removing greenhouse gas emissions, since CO2 is our dominant output and accounts for most of the planet’s warming.


Greenhouse gas emissions by type, 1990-2015.

The concept of net zero accounts for planetary sources and sinks. The concept of “gross zero”(or, less properly, “absolute zero”) refers to the complete elimination of all emissions, which is not realistic. There is no simple equation for net zero, because of the immensity and complexity of the world’s climate system. Attempts to quantify the carbon removal effects of, for example, oceanic plankton, tropical rainforests, and norther taiga, are ongoing efforts but have considerable margins for error. Furthermore, their roles are not static. Warming oceans and active deforestation in the tropics and throughout the north are changing those drawdowns annually (see how noisy the signals for land and atmosphere are in the diagram).


Global emissions and global sinks for carbon dioxide.

Our baseline check on net zero emissions is by measuring atmospheric concentrations of greenhouse gases. National inventories and goals—and goals by sub-national and non-state actors like states, cities and companies—are critical but are not the end in themselves. The global stocktakes, required every five years by the Paris Agreement (with 2021’s stocktake delayed to 2023 due to COVID) are the most visible check on nation-by-nation emissions. To the extent that nationally determined contributions (NDCs) are informed by science, they should represent reasonably accurate estimates of each country’s total emissions. Not all pledges, however, are adequate, and not all are even law.


Climatic adequacy of countries' NDCs (as of 2020).

Gross zero would result in declining concentrations of greenhouse gases, since we would not be replacing those drawn down naturally. (I don’t count sequestering, which has yet to show any realistic potential.)  Our strategies for achieving net zero center on three general spheres of activity (described in far more detail in the third volume of the IPCC’s 6th Assessment Report):

1.      Replacement of fossil fuels with alternate (renewable and…nuclear?) energy sources;

2.      Increased efficiency where fossil fuels are still used;

3.      Restoration of natural carbon sink environments like forests and swampland.


Legal status of countries' NDCs around the world.

While our society remains a five-alarm fire in so many other respects, we certainly have an immense task in front of us to bring our global emissions into balance with nature’s capacity to absorb them. We have eight years until the first major checkpoint, and another twenty until the second. Every day counts.

Tomorrow: demand, services and social aspects of mitigation.

Be brave, be steadfast, and be well.

Monday, July 25, 2022

365 Days of Climate Awareness 347 – AR6 Vol. 3, Chap. 4: Near- and Mid-Term Mitigation Strategies


The first global stocktake of greenhouse gas (GHG) emissions under the 2015 Paris Agreement was delayed, due to COVID, from 2021 to 2023, so it will not be until next year when we have any kind of detailed reporting on countries’ progress toward their Nationally Determined Contributions (NDCs). However, those NDCs, as they currently stand, are not sufficient to have the planet on the optimal GHG reduction path by 2030 (near-term), toward net zero emissions by 2050 (mid-term). This deficiency is known as the “emissions gap”. Further, available information indicates that countries are falling short of their pledges (NDCs), known as the “implementation gap”. (2100 is “long-term”.)


Illustration from the IPCC 6th Assessment Report, Vol. 3, Chap. 4. GHG emissions to 2100.

The current trajectory of emissions is toward 57 (52-60)  GtCO2e-yr-1 (gigatons of carbon dioxide equivalent per year). According to IPCC models, if the goal is set as the Paris Agreement target of 1.5°C/2.7°F global increase by 2050, this leaves an emissions gap of 26 GtCO2e-yr-1. If the goal is 2.0°C/3.6°F with limited overshoot, the emissions gap is 17 GtCO2e-yr-1. The implementation gaps are almost certainly worse. In short, we’re way behind schedule.


Illustration from the IPCC 6th Assessment Report, Vol. 3, Chap. 4. Mitigation potentiaal of sub-national and non-state actors.

To make up the gaps, countries will need to pursue additional strategies. Though estimates do vary on the economic impacts of mitigation (some studies show GDP increasing despite mitigation policies consistent with 1.5°C increase. What is far easier to predict is that the impact of accelerated climate mitigation will fall unevenly on different sectors and therefore, depending on the character of their economies, on nations. Fossil fuel extraction and processing industries—coal, oil and gas—are on the chopping block, which is the primary reason for concerted industry-wide resistance to action on climate change. (A quick bit of economics: roughly 1.5 trillion barrels of oil remain in the ground. Assuming a standard recovery of 50%, 750 billion barrels could be produced. Assume a median price of $75 per barrel: those unrecovered barrels represent $56.25T in gross profit. That’s the logic behind denial.)


From Our World In Data. China and India coal consumption, 1965-2021.

Mitigation can occur at several levels: international (cooperation between sovereign governments), national, sub-national (but still governmental—i.e. national provinces and US states) and non-state (usually within one country, but sometimes spanning more than one). Activism and changes in private industry make up the bulk of non-state activity. Increased efficiency in products (though this is often the product of national regulations) is one avenue. Sector shifts such as the move, for economic reasons, away from coal (in most countries except China and India) toward natural gas and renewables, and the growing electric vehicle (EV) market are others.  

Tomorrow: net zero emissions defined.

Be brave, be steadfast, and be well.

IPCC 6th Assessment Report, Vol. 3, Chap. 4

Not-Quite-Daily Climate Awareness The Inflation Reduction Act of 2022

(It might take me a while to find a workable new title. Bear with me.) Now that US President Joe Biden has signed the Inflation Reduction Ac...